Memstrack

![]()
A memory allocation trace, like a hot spot analyzer for memory allocation, it can help analyze overall memory usage, peak memory usage, kernel module memory usage. Userspace memory trace is planned and not yet implemented.
Usage
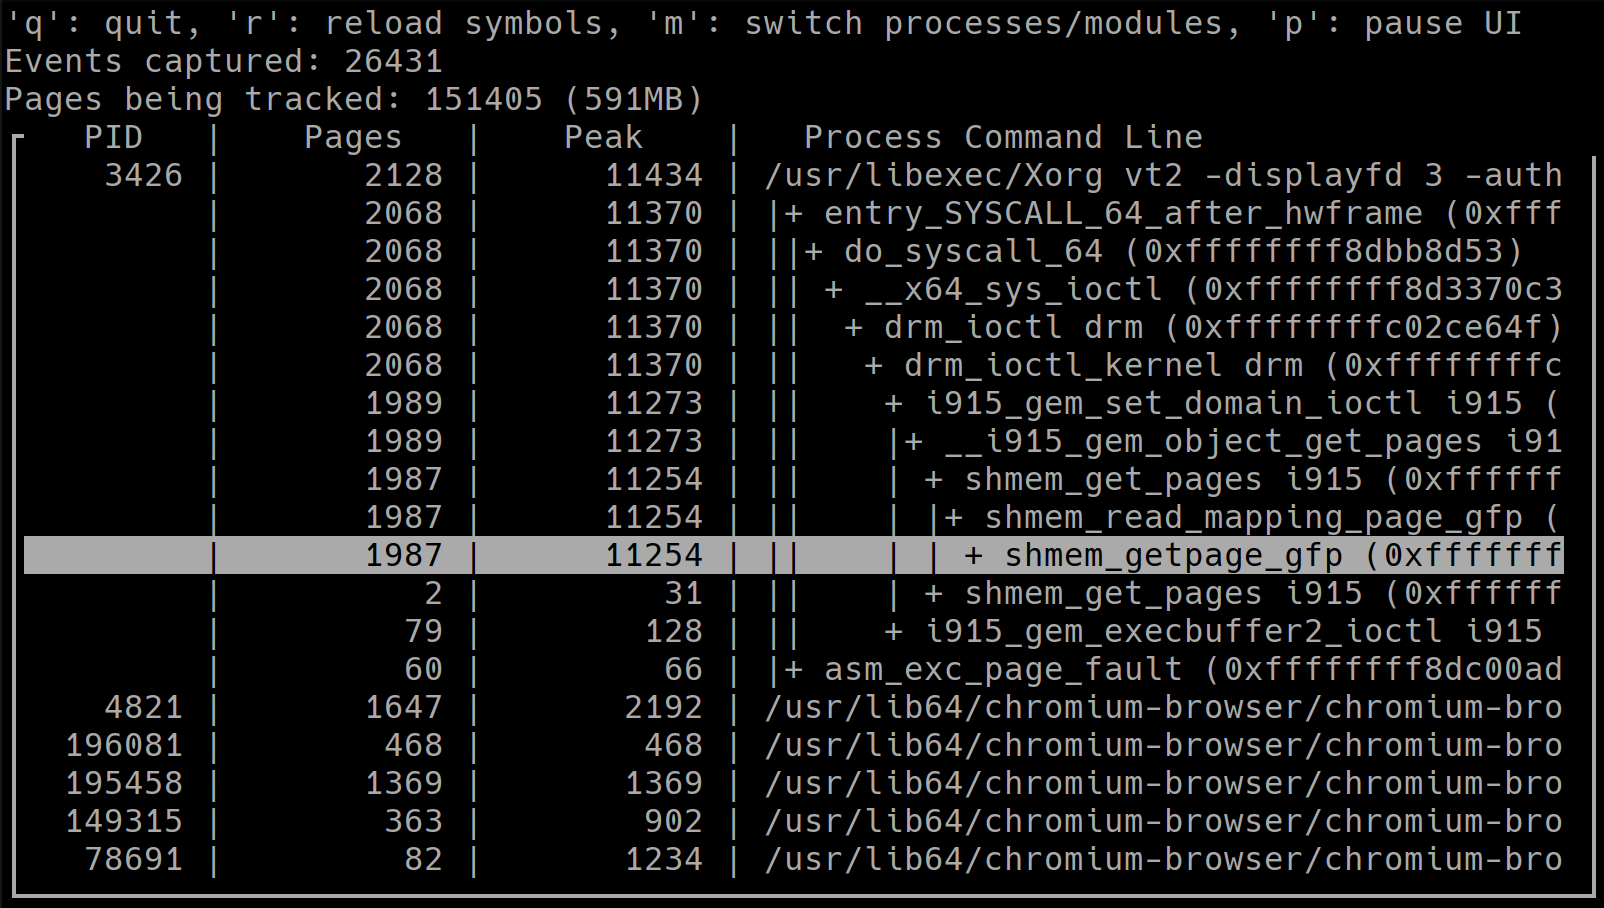
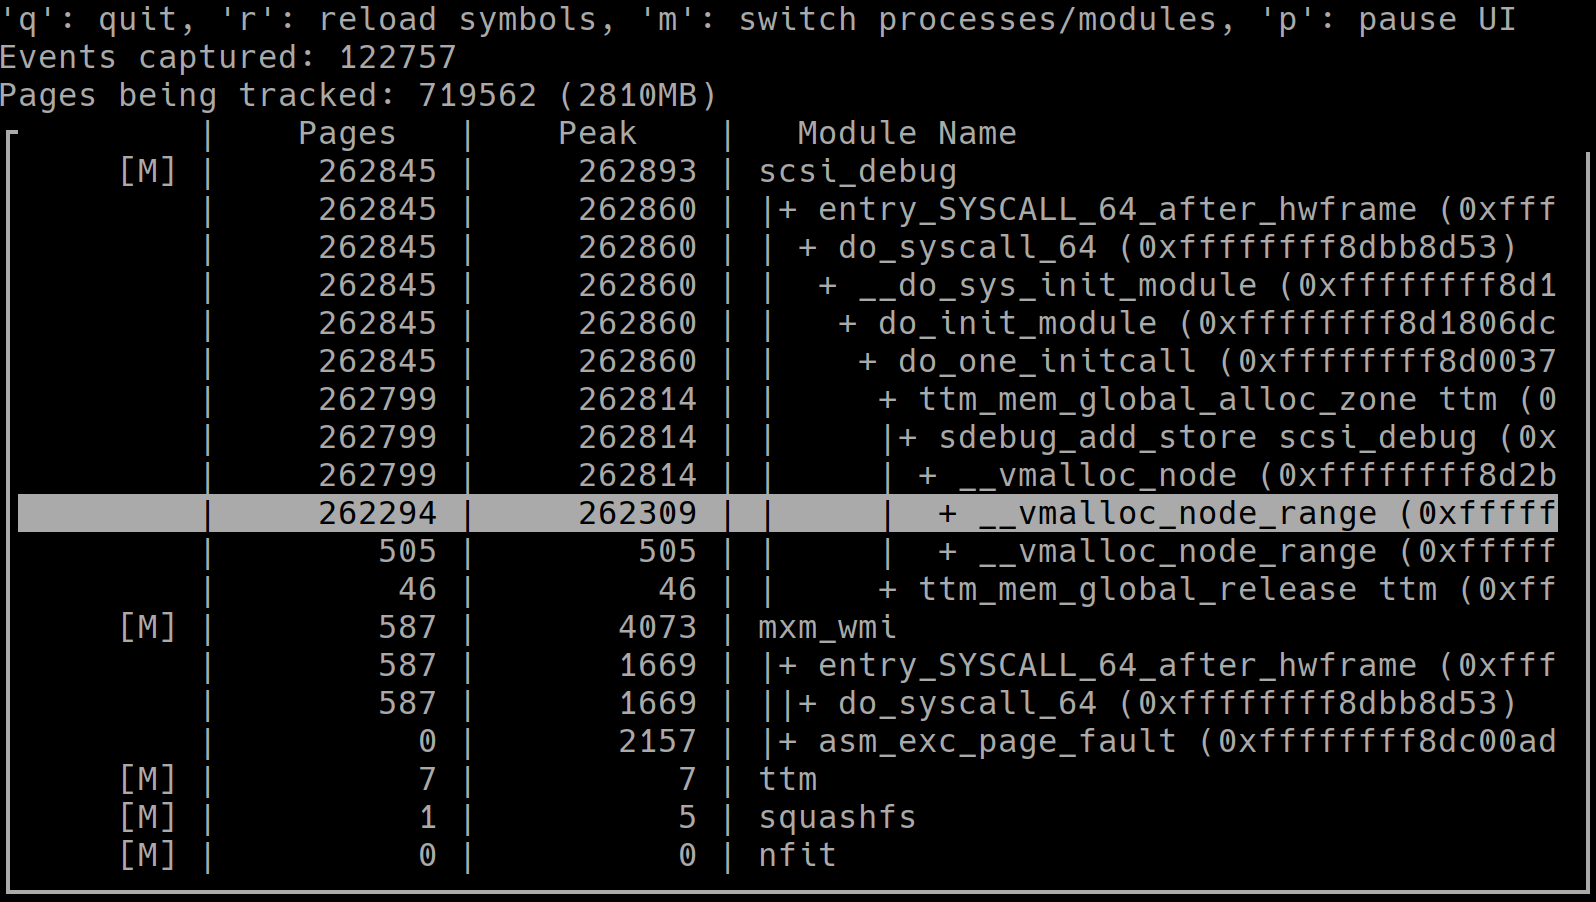
It has a TUI showing current memory allocation status:
And can generate reports of memory allocation and usage of a long period.
A example report, which shows the memory usage summary of a typical kdump run on Fedora 32 in a KVM VM:
# Following report is genereted with
# `memstrack --report module_summary,module_top --notui --throttle 80`

======== Report format module_summary: ========
Module squashfs using 26.8MB (6868 pages), peak allocation 35.1MB (8976 pages)
Module virtio_console using 1.5MB (377 pages), peak allocation 1.5MB (377 pages)
Module overlay using 1.5MB (372 pages), peak allocation 2.2MB (568 pages)
Module virtio_blk using 0.9MB (241 pages), peak allocation 0.9MB (241 pages)
Module virtio_net using 0.5MB (129 pages), peak allocation 0.5MB (129 pages)
Module sunrpc using 0.1MB (15 pages), peak allocation 0.1MB (15 pages)
Module qemu_fw_cfg using 0.0MB (4 pages), peak allocation 0.0MB (4 pages)
======== Report format module_summary END ========
======== Report format module_top: ========
Top stack usage of module squashfs:
  (null) Pages: 6868 (peak: 8976)
    async_page_fault (0xffffffff81c0137e) Pages: 4643 (peak: 6264)
      do_page_fault (0xffffffff81075861) Pages: 4643 (peak: 6264)
        do_user_addr_fault (0xffffffff81075109) Pages: 4643 (peak: 6264)
          handle_mm_fault (0xffffffff81298074) Pages: 4643 (peak: 6264)
            __handle_mm_fault (0xffffffff81297ac8) Pages: 3770 (peak: 5391)
              __do_fault (0xffffffff8128f3b6) Pages: 3770 (peak: 5391)
                filemap_fault (0xffffffff81255dce) Pages: 3674 (peak: 5234)
                  __do_page_cache_readahead (0xffffffff812611fa) Pages: 3151 (peak: 4522)
                    read_pages (0xffffffff81260fb2) Pages: 3151 (peak: 4522)
                      squashfs_readpage squashfs (0xffffffffc0025064) Pages: 2973 (peak: 4342)
                        squashfs_readpage_block squashfs (0xffffffffc0027289) Pages: 2132 (peak: 3185)
                          squashfs_copy_cache squashfs (0xffffffffc0024a99) Pages: 2132 (peak: 3185)
                            pagecache_get_page (0xffffffff81254b33) Pages: 2132 (peak: 3185)
                              __alloc_pages_nodemask (0xffffffff812b6443) Pages: 2132 (peak: 3185)
                                __alloc_pages_nodemask (0xffffffff812b6443) Pages: 4264 (peak: 6370)
Top stack usage of module virtio_console:
  (null) Pages: 266 (peak: 266)
    ret_from_fork (0xffffffff81c00215) Pages: 266 (peak: 266)
      kthread (0xffffffff81106c59) Pages: 266 (peak: 266)
        worker_thread (0xffffffff811008f0) Pages: 266 (peak: 266)
          process_one_work (0xffffffff811006f5) Pages: 266 (peak: 266)
            control_work_handler virtio_console (0xffffffffc0159496) Pages: 265 (peak: 265)
              add_port virtio_console (0xffffffffc0159198) Pages: 254 (peak: 254)
                fill_queue virtio_console (0xffffffffc0158faa) Pages: 254 (peak: 254)
                ... snip ...
Quick start
Installation
In Latest Fedora/CentOS, this package is available by default, install it with dnf.
dnf install memstrack
Or, you can also install from source, just clone the repo and build it.
# First Make sure you have gcc git make ncurses-devel installed
# Then clone it
git clone https://github.com/ryncsn/memstrack.git

# Build it
cd memstrack
make
Basic usage:
# Run it, a TUI will show up:
./memstrack

# Print help info:
./memstrack --help

# Another Example, run memtrack without TUI and generate report to file "report.result"
./memstrack --notui --report task_top --output report.result
Using memstrack with dracut:
In latest Dracut, it supports using memstrack to analyze the memory usage in during initramfs stage. This is especially useful for kdump to debug memory usage issue. To enable memstrack integration in dracut, first ensure memstrack is installed. If it's not installed, please install and rebuild the initramfs. Then simply append rd.memdebug=4 or rd.memdebug=5 to the kernel cmdline is enough.
With rd.memdebug=4, memstrack will generate a memory usage report of all loaded kernel modules, this can help you find out which kernel module used the most memory, and also their peak memory usage.
With rd.memdebug=5, memstrack will generate a memory usage report of all loaded kernel modules, along with the top stacks that allocated these memories. This can help you find out which kernel module, and exactly which stack used the most memory, and also including the peak memory usage of each stack.
Use with older version of Dracut
For older version of Dracut, memstrack could also be installed as a standalone plugin from source code repository.
# Assume you have cloned the source code and now in the source code top directory
make dracut-module-install
To use it, append "rd.memstrack=<level>" to kernel cmdline. The command line format is a bit different here, to avoid conflict with Dracut's builtin rd.memdebug in older version. The available levels are:
rd.memstrack=1: only simple summary will be printed to console during boot. rd.memstrack=2: summary will be printed to console, and also prints the top stacks which consumes most memories. rd.memstrack=3: memstrack will print everything, use with caution as this will likely to flood your console.
Note
For for Linux kernel using ORC unwinder and have version below 5.2, there is a bug that tracepoints unable to generate stack trace properly using perf, so you might get empty stack trace data when using perf backend. To avoid such problem, please update your kernel to latest version, or use ftrace backend as a workaround (with heavy performance downgrade).